InBody Result Sheet shows a variety of parameters related to our health.
Everything you need to know is to interpret InBody Results and start offering your clients the insights they need to improve their health.
With an explanation of Result Sheet and Parameter keynotes, you’ll learn what the terms on the Result Sheet mean, why they’re valuable, and the strategies you can use to implement this invaluable data into your research and patient’s health management.
BWA
What Does Your InBody Result Sheet Mean?
Result Sheet Keynote
Keynote 1 : Body Composition Result
Keynote 2 : Body Water Result Sheet
Keynote 3 : Children Result Sheet
Keynote 4 : Research Result Sheet
Keynote 5 : Comparison Result Sheet
Keynote 6 : Evaluation Result Sheet
Parameter Keynote
Keynote 1: ECW Ratio
Keynote 2: Phase Angle
Keynote 3: Skeletal Muscles
Keynote 4: Visceral Fat
Uses of BWA
Keynote 1 : Enhance Patient Care
Keynote 2 : Risks of ECW
Keynote 3 : Positive Role of ICW
Keynote 4 : Science-based Uses
Keynote 5 : Rehabilitation
Keynote 6: Oncology & Body Water
Keynote 7: Advanced Analysis
KEYNOTE 1
Extracellular Water Ratio (ECW Ratio)
Extracellular Water Ratio (ECW Ratio) indicates the ratio between Extracellular Water (ECW) and Total Body Water (TBW).
ECW Ratio = ECW / TBW
It is a parameter that indicates the balance of body water. Health people maintain stable ratio at about 3:2 between the Intracellular Water (ICW) and Extracellular Water (ECW). When this ratio is broken, edema may occur. A normal range of ECW Ratio is 0.360~0.390. BWA provides both Whole Body and Segmental ECW Ratio. With Segmental ECW Ratio, you can check if the ICW and ECW are balanced in each body segment.
BWA measures ICW and ECW separately, so it can detect the invisible changes in body water. By analyzing BWA results, you can check
– Blood or lymph circulation can be checked.
– Post surgery recovery can be monitored.
– Fluid balance in hemodialysis patients can be monitored.
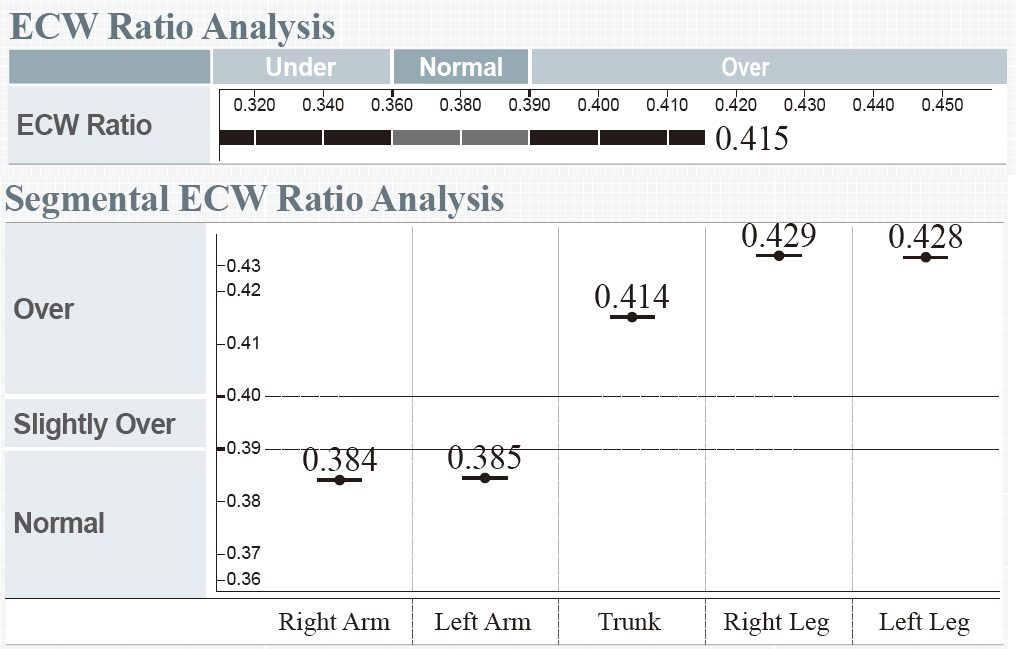
*Figure 1. Whole Body and Segmental ECW Ratio Analysis from Body Water Result Sheet
Not just Body Water Result Sheet, Evaluation Result Sheet also provides with age-evaluation graph of your ECW Ratio.
As shown in the right, it provides grey area which indicates the range of mean and standard deviation of the Whole Body ECW Ratio by age (from 20 to 80 years old). So you can better understand the relative position.
The X-axis of the graph represents age (years), the Y-axis represents Whole Body ECW Ratio (ECW/TBW), and the top and bottom of the shaded graph are +.-mean standard deviation.
Graph Interpretation
1.Today’s measurement result
2.Average range of whole body ECW Ratio by age
3.ECW Ratio under 0.390 is considered as “Normal”, 0.390~0.400 “Slightly Over”, and over 0.400 “Over”
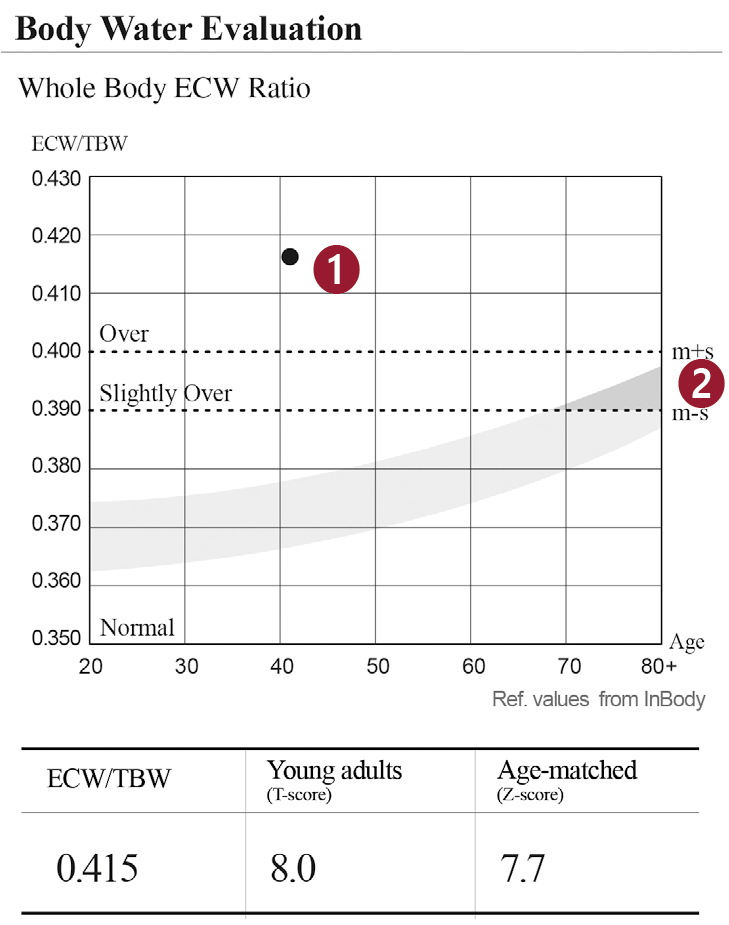
*Figure 2. Age-specific Graph of Whole Body ECW Ratio from Evaluation Result Sheet
KEYNOTE 2
Phase Angle(PhA)
Phase Angle (PhA) indicates the level of structural integrity and function of the cell membrane. It can be used as an evaluation indicator for edema, rehabilitation, nutrition problem, and etc.
Understand Impedance, Reactance and Phase Angle
InBody measures Impedance value by sending weak alternating current through the body. Based on it, the body water and body composition is obtained.
The current flows along the body water and if there’s a lot of body water, the impedance value decreases and vice versa. InBody measures the impedance of the Right Arm (RA), Left Arm (LA), Trunk (TR), Right Leg (RL), and Left Leg (LL) for each frequencies.
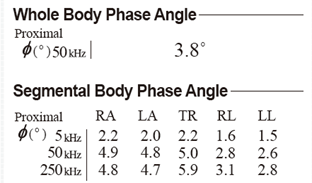
*Figure 3. Whole Body and Segmental Phase Angle from Body Composition Result Sheet
Impedance (Z): Impedance is a generic term for the resistance and the resistance is largely divided into Resistance (R) and Reactance (Xc). In human body, Resistance (R) occurs in the body water, and Reactance (Xc) is the resistance occurs in the cell membrane.
The Impedance, Resistance, and Reactance is in trigonometric relationship which means the impedance is the vector sum of Resistance and Reactance. Therefore, by knowing Impedance and Phase Angle in InBody, Resistance and Reactance can be measured.
Phase Angle (PhA): PhA is proportional to the Reactance, and since reactance is the resistance occurring at the cell membrane, PhA is related to the health status of the cell. Improvement in the strength of the cellular membrane and structural function will increase the phase angle and damages or decrease in function will result in the decrease in the Phase Angle. Therefore, the Phase Angle remarkably decreases in patients suffering from chronic or wasting diseases such as cancer or kidney diseases.
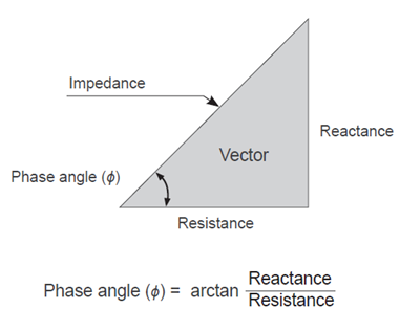
*Figure 4. Phase Angle as a Resistor and Capacitor in Series
Not just Body Composition Result sheet, Comparison Result Sheet enables you to easily compare current and previous PhA by providing Cole-Cole Plot graph.
Graph Interpretation
As shown in the right, the X-axis represents the resistance (R, Ω) and the Y-axis represents the reactance (Xc, Ω). When graph move to the left, it means there is more water in the body, and when the Y-axis move upwards, it means the cell membranes are stronger. By comparing the graphs, you can compare results at a glance. For reference, Standard median curve is the average of the adult population.
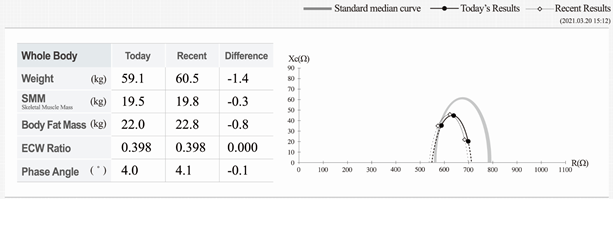
*Figure 5. Phase Angle Cole-Cole Plot Comparison Result Sheet
Lastly, Evaluation Result Sheet provides with age-evaluation graph of your PhA.
As shown in the right, it provides grey area which indicates the range of mean and standard deviation of the PhA by age (from 20 to 80 years old).
The X-axis of the graph represents age (years), the Y-axis represents Whole Body Phase Angle, and the top and bottom of the shaded graph are +.-mean standard deviation.
Graph Interpretation
1.Today’s Measurement Result
2.Average range of Whole Body Phase Angle by age.
3.Age-matched (Z-score) indicates measured value compared to the same age group. If the values is in negative (-) values, it is below average. If the value is in positive (+), then the subject is above average.
The decreasing tendency of Whole Body Phase Angle is seen from age 20-80. This is due to the increase in the Extra Cellular Water which is easily effected by the decreasing muscle cells due to lacking nutritional intake, imbalance of the body water ratio due to diseases, Sarcopenic obesity and many more as you age.
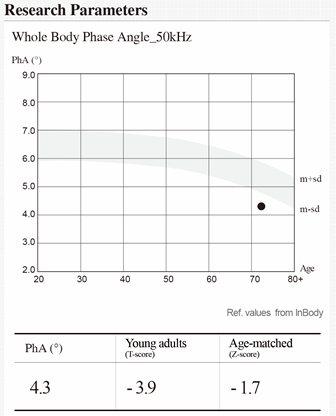
*Figure 6. Age-Specific Graph of Whole Body PhA from Evaluation Result Sheet
KEYNOTE 3
Skeletal Muscle Mass (SMM)
The muscle is composed of Cardiac Muscle, Smooth Muscle and Skeletal Muscle. Skeletal Muscle is located in between bones and joints and it can be moved voluntarily. The Skeletal Muscle Mass (SMM) can be changed significantly with physical activity. If the SMM is 100%, it means that there is sufficient amount of muscle mass compared to your ideal weight.
Graph Interpretation
1.Check amount of Weight, Skeletal Muscle Mass and Body Fat Mass in kg.
2.Check ratio of Weight, Skeletal Muscle Mass , Body Fat Mass which is based on the ideal weight.
How to use Muscle-Fat Analysis
The followings are the methods of using Muscle-Fat Analysis based on the length of the bar graph in Weight, Muscle Mass, and Body Fat Mass.
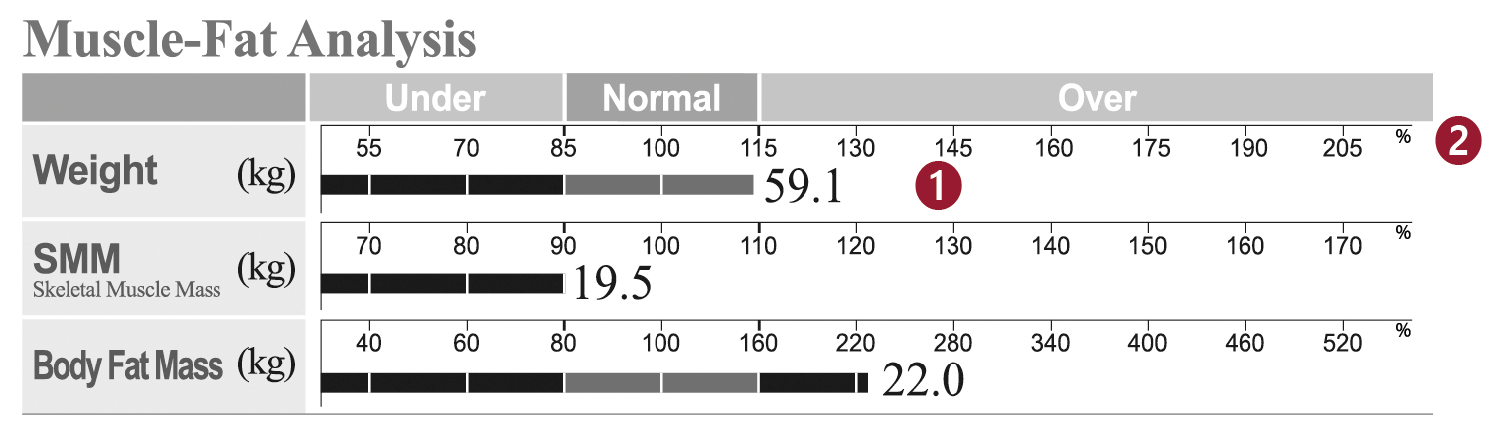
*Figure 7. Muscle-Fat Analysis from Body Composition Result Sheet
C-shape: A C-shaped person has a shorter bar for SMM than for weight and Body Fat Mass. Although this is characteristic of someone who is overweight or obese, you may see this shape in someone who is normal or underweight, too. For people who doesn’t have enough amount of muscle such as skinny obese person.
I-shape: An I-shaped individual has a “balanced” body composition, meaning their Weight, SMM, and Body Fat Mass bars roughly form a straight line. However, they can still have health risks if they have too much body fat.
Furthermore, a person tend to lose muscle and gain fat as getting old because of the metabolic changes. So the person with I-shape has to keep monitor whether it changes into C-shape.
D-shape: A D-shaped person has a longer SMM bar than both their weight and body fat bars. This is indicative of an “athletic” body type and is considered to be the ideal body composition shape.
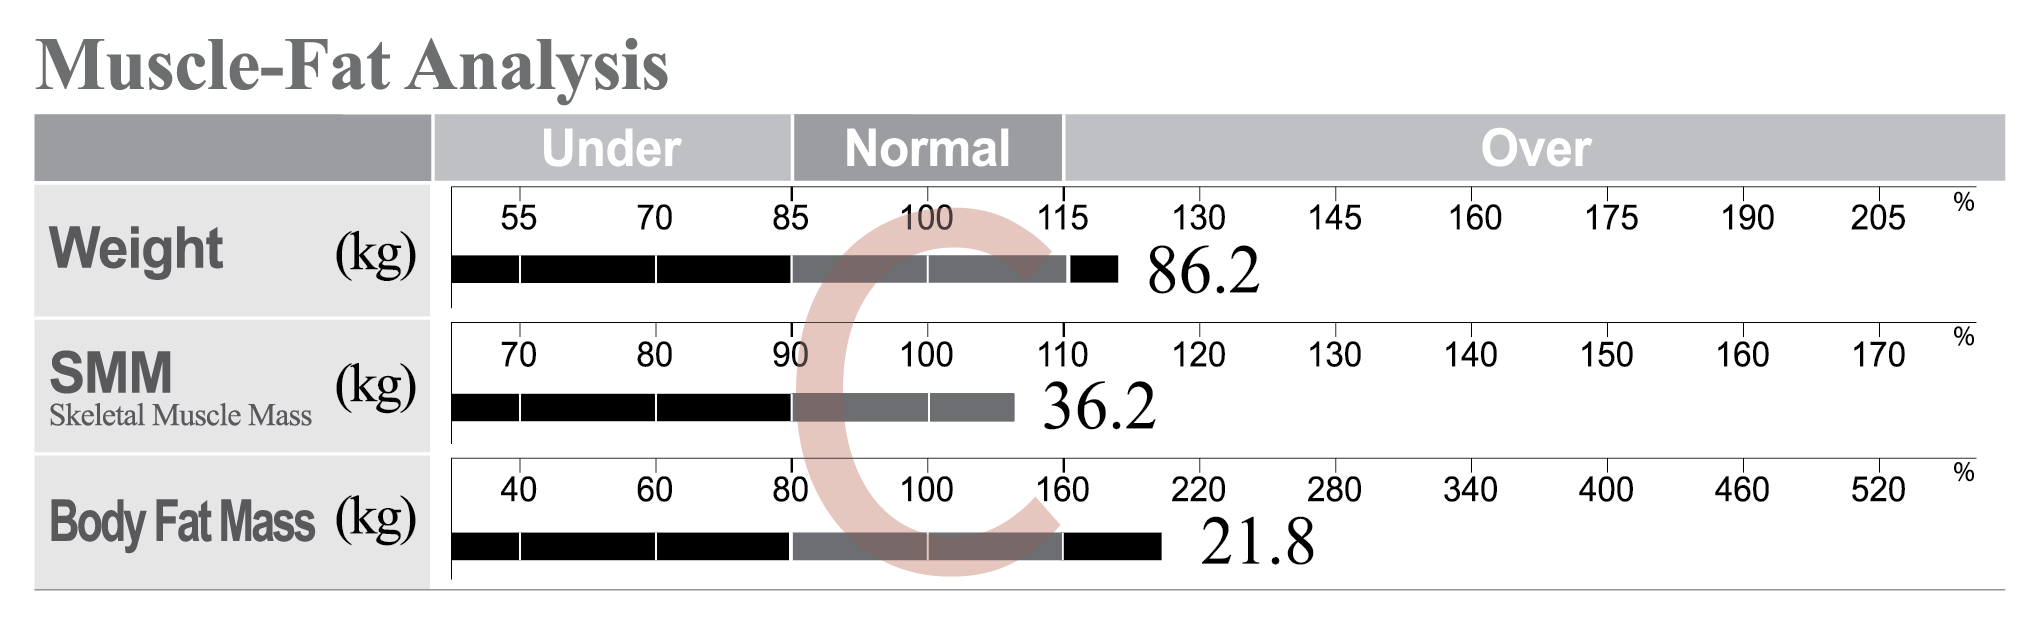
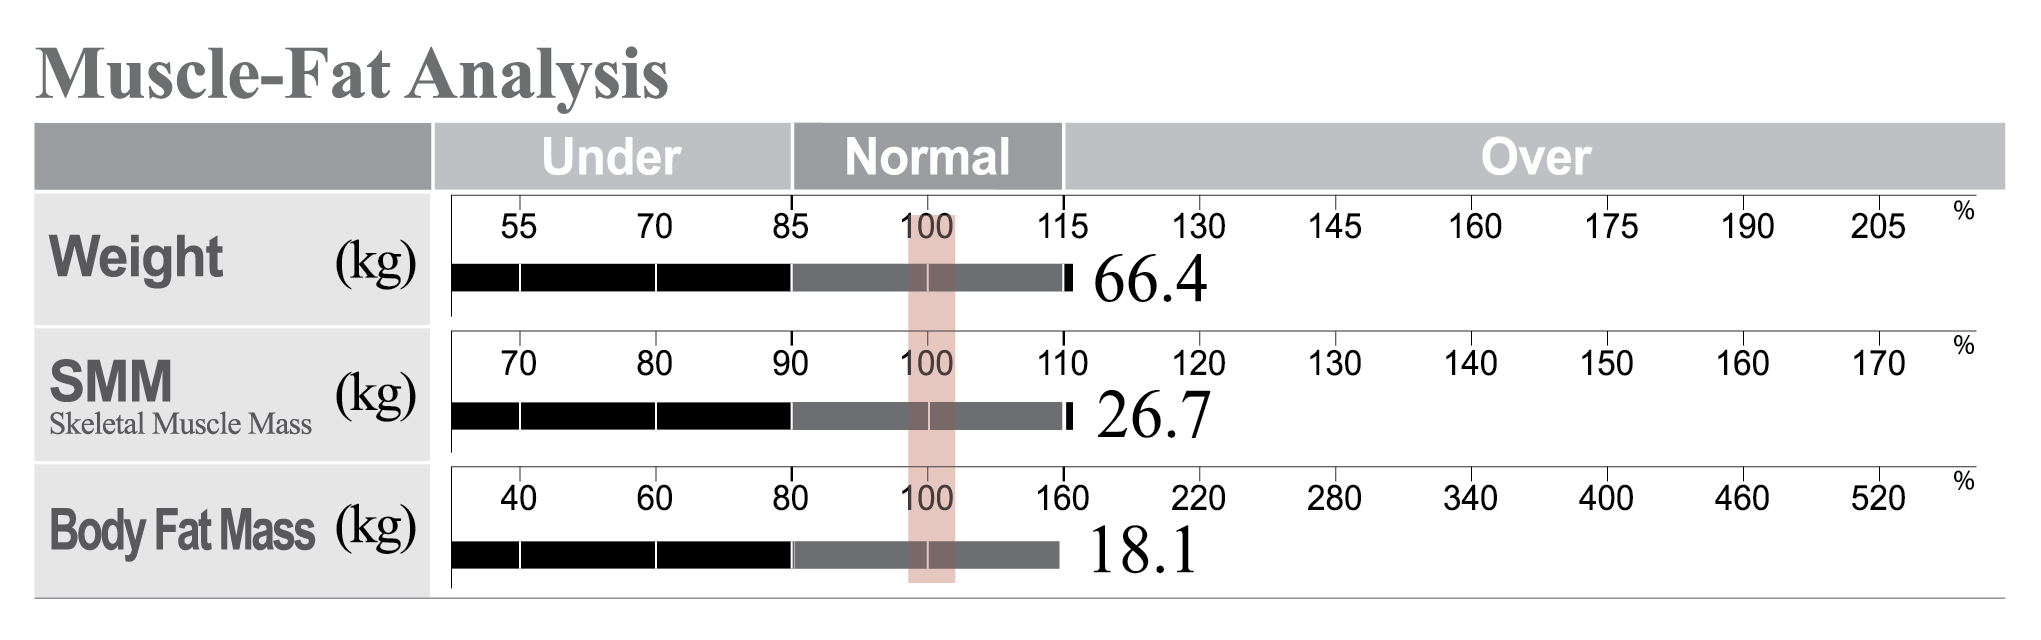
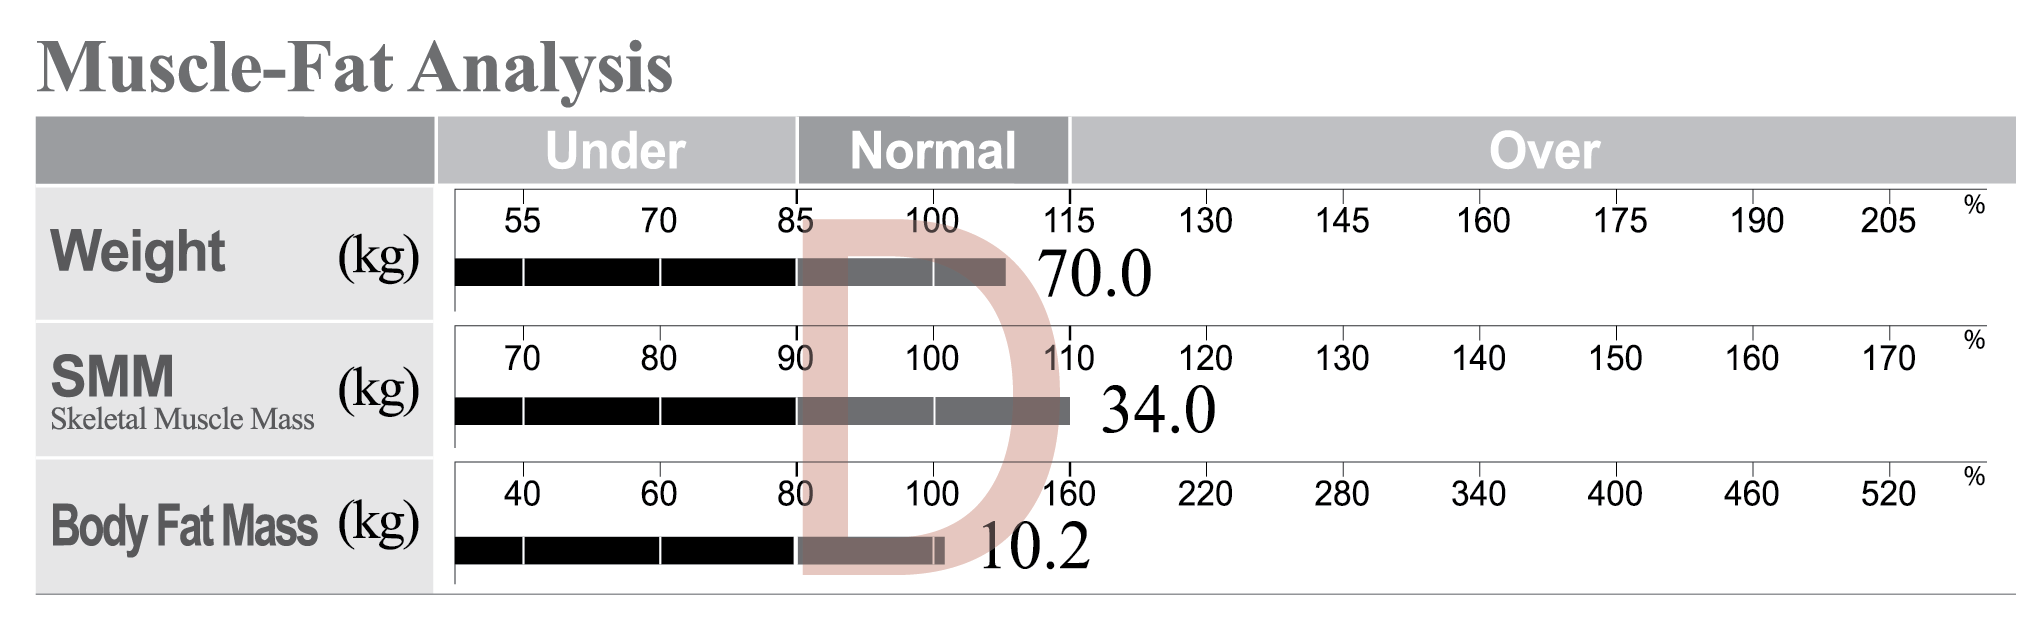
*Figure 8. Muscle-Fat Analysis with C, I, D Shape from Body Composition Result Sheet
Segmental Lean Analysis further helps to plan more specific physical activity plans by analyzing the Fat Free Mass in each segments.
The Fat Free Mass of Arms, Trunk and Legs will be expressed with two bar graphs. Among two bars, the length of top bar shows how much Fat Free Mass is compared to the ideal weight and bottom bar shows how much lean mass is to your current weight.
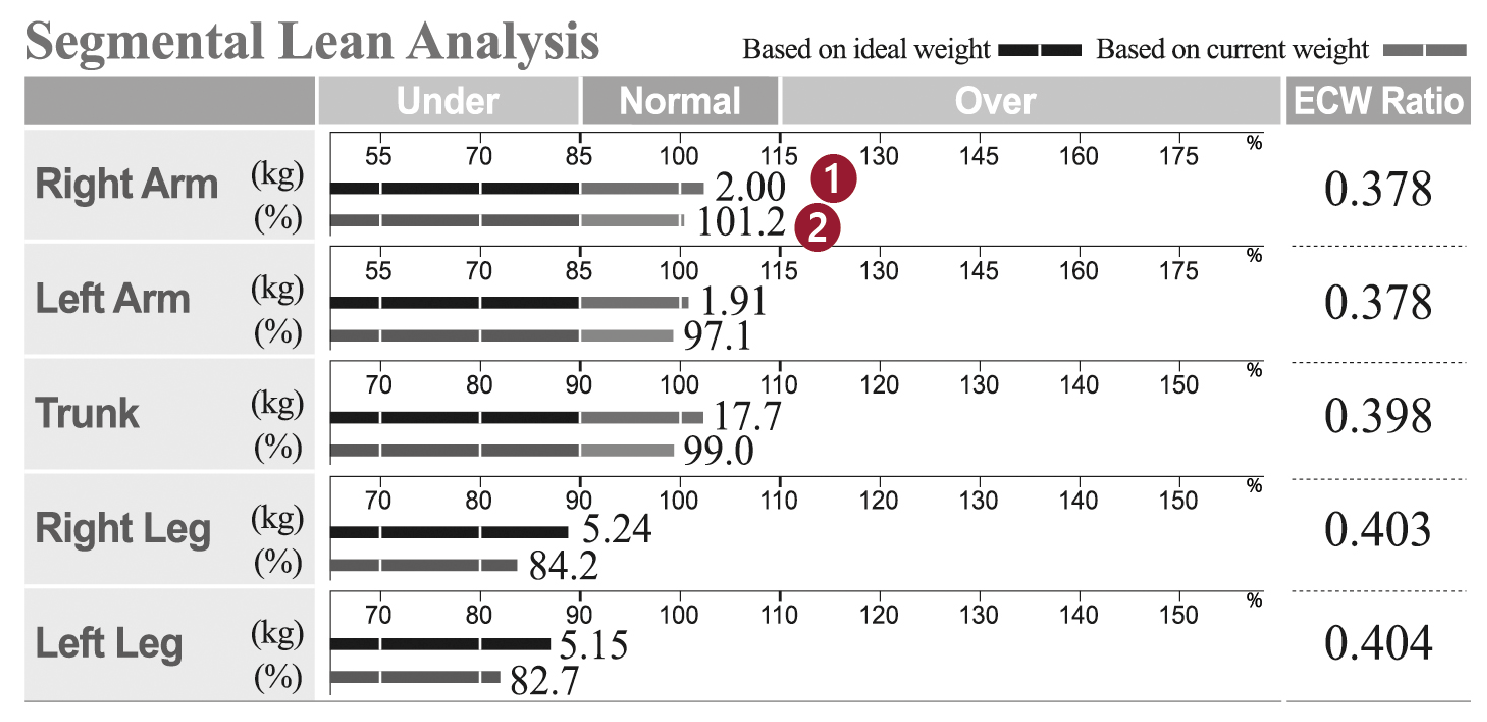
*Figure 9. Segmental Lean Analysis from Body Composition Result Sheet
Graph Interpretation
1.Top bar: It is the amount of lean mass in kg. The length of bar shows how much muscle mass there is compared to the ideal body weight. In other words, 7.5kg of muscle mass in the right leg is 100% to the ideal body weight, which is identical to the ideal muscle mass required.
2.Bottom bar: It shows the lean mass in percentage. The length of the bar shows the percentage of the lean mass compared to the current weight. In other words, 7.5kg of muscle which is present is equal to the ideal body weight but compared to the current weight it is only 88%. Therefore, 7.5kg muscle at the moment is not enough to sustain the current body weight.
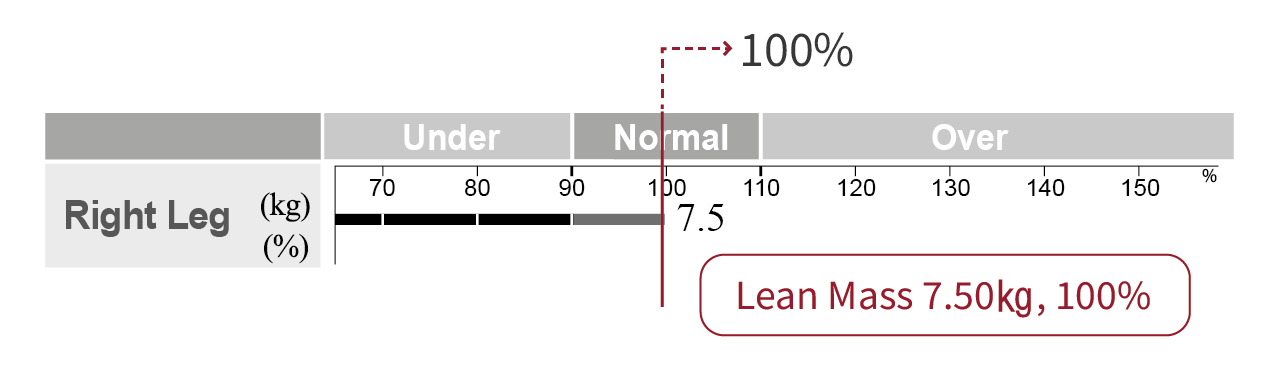
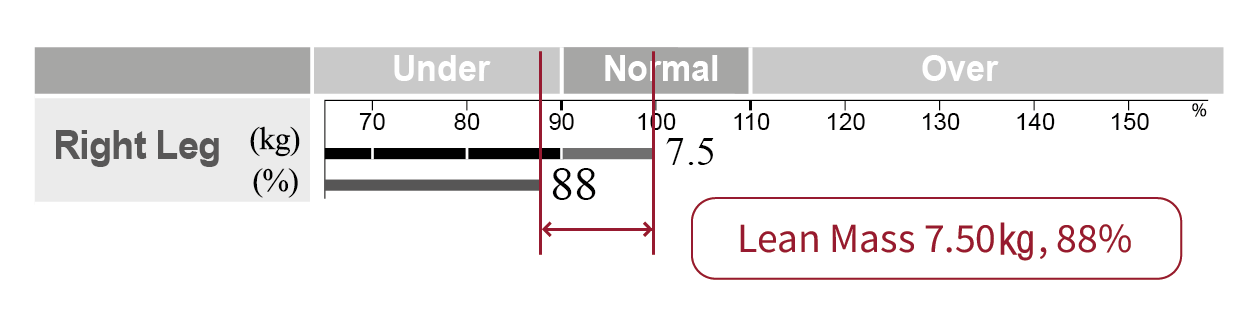
*Figure 10. Segmental Lean Analysis from Body Composition Result Sheet
InBody also provides SMI. SMI is the abbreviation of Skeletal Muscle mass Index, which can be calculated by dividing the sum of the segmental muscle mass to height squared. It is an index that can be used to diagnose diseases related to muscle mass reduction called “sarcopenia” that can occur due to physiological changes in the elderly population. Recently, the use of SMI in Sarcopenia research is increasing. The European assessment criteria for male is 7.0kg/m2 and 6.0kg/m2 for female.
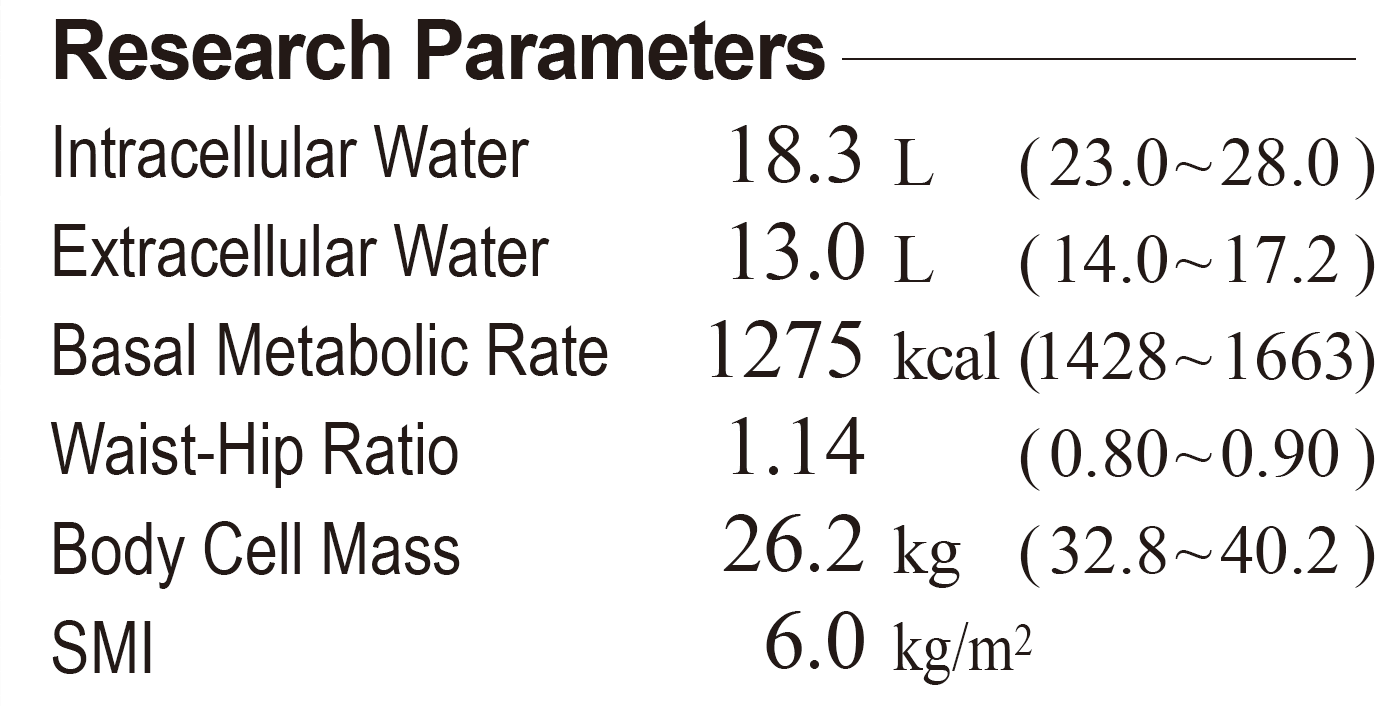
*Figure 11. SMI in Research Parameters from Body Composition Result Sheet
Not just Body Composition Result Sheet, Evaluation Result Sheet also provides with age-evaluation graph of your SMI.
As shown in the right, it provides grey area which indicates the range of mean and standard deviation of the SMI by age (from 20 to 80 years old). The X-axis of the graph represents age (years), the Y-axis represents SMI (kg/m2), and the top and bottom of the shaded graph are +.-mean standard deviation.
Graph Interpretation
1. Today’s Measurement Result
2.Age-matched (Z-score) indicates measured value compared to the same age group. If the values is in negative (-), it is below average. If the value is in positive (+), then the subject is above average.
3.The cut off of Sarcopenia is 7.0kg/m2 for male, and 6.0kg/m2 for female, according to the European Working Group on Sarcopenia in Older People (EWGSOP).
The decreasing tendency of SMI is seen from age 20~80. This is due to lacking nutritional intake, hormonal change increasing fat mass resulting in the decrease in the muscles in the leg.
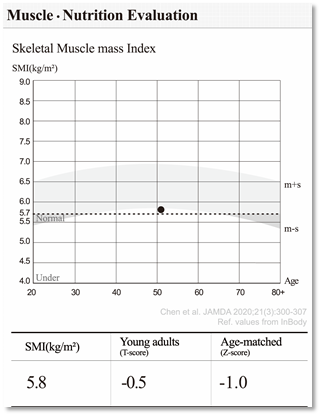
*Figure 12. Age-Specific Graph of SMI from Evaluation Result Sheet
KEYNOTE 4
Visceral Fat
The body fat can be divided into Visceral Fat, Subcutaneous Fat, and fat between the muscles according to its location. Visceral Fat is the fat that is distributed between the intestines and causes abdominal obesity. Visceral Fat Area (VFA) is the cross-sectional area of this Visceral Fat.
Graph Interpretation
The grey area in the graph shows how the Visceral Fat is distributed throughout the age, and person’s today’s measurement result is marked with a (+). Cut off value of VFA as 100cm2 and it is important to monitor the trends of the changes.
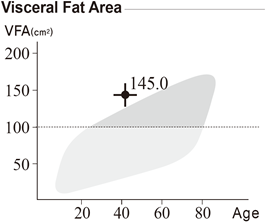
*Figure 13. Visceral Fat Area from Body Composition Result Sheet
Visceral Fat Level (VFL) shows the Visceral Fat Area in a level. Level 1 of the VFL is 10cm2, so Level 5 means 51 to 60 ㎠ of visceral fat. Visceral Fat Level tends to increase as we age and if the Visceral Fat Level is 10 and above, the risk of lifestyle diseases increases. The gold standard of visceral fat measurement through direct measurement like CT scans.
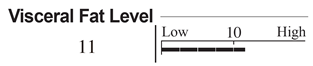
*Figure 14. Visceral Fat Level from Body Composition Result Sheet
Not just Body Composition Result Sheet, Evaluation Result Sheet provides Visceral Fat Area with age-evaluation graph.
As shown in the right, it provides grey area which indicates the range of mean and standard deviation of the VFA by age (from 20 to 80 years old). The X-axis of the graph represents age (years), the Y-axis represents VFA, and the top and bottom of the shaded graph are +.-mean standard deviation.
Graph Interpretation
1.Today’s Measurement Result
2.VFA Evaluation Cutoff that can assess patients’ health status. InBody Evaluates “Over” if it is more than 100 ㎠.
In general, children have lower visceral fat area than adults even when their WHR is high, and the visceral fat increases with age. The reason is that most children develop subcutaneous fat first rather than visceral fat. On the other hand, as we age, the physiological action accelerates visceral fat accumulation so the visceral fat area increases.
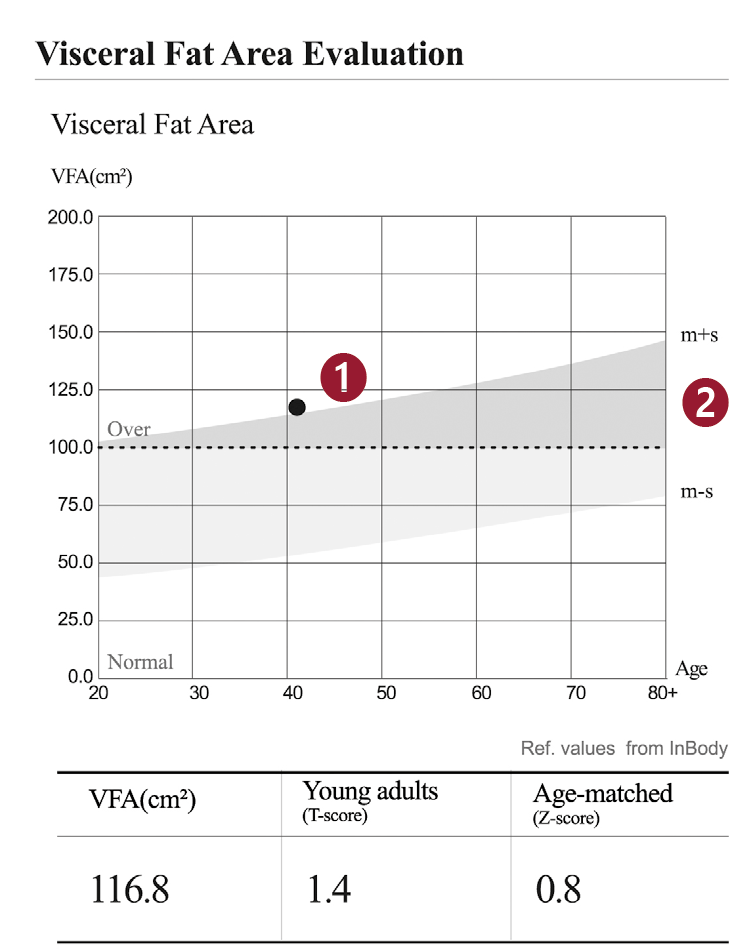
*Figure 15. Age-Specific Graph of VFA from Evaluation Result Sheet